프로메테우스의 웹 인터페이스를 통하면 어떤 정보가 수집됬는지 일목요연하게 볼 수도 있고 간단한 쿼리도 가능하다.
프로메테우스의 각각의 정보들은 고수준 정보부터 저수준 정보까지 다양하게 존재한다.
관리자가 할 일은 프로메테우스가 엔트포인트에서 주기적으로 정보를 수집 가능하게 하는것
프로메테우스로 애플리케이션의 유용한 정보를 측정값으로 구성할려면 이들 정보를 생성하는 코드를 작성해 HTTP 엔드포인트로 출력해야 하기 때문에 이미 만들어진 도커 엔진의 측정값을 수집하는 것보다는 좀더 수고가 필요하다.
실습1 (프로메테우스 애플리케이션 컨택)
root@DESKTOP-KU8L7UV:/home/user/080258/ch09/exercises# docker container rm -f $(docker container ls -aq) #기존 컨테이너들 삭제
989e5ea933d2
d79639a41a45
a0e372060f65
root@DESKTOP-KU8L7UV:/home/user/080258/ch09/exercises# docker network create nat #네트워크 'nat' 생성 (디폴트 브릿지)
b9515c3f23b762722db06dce2880a4b947f3ded32ef90f1f62aac1e96ba4d2b7
root@DESKTOP-KU8L7UV:/home/user/080258/ch09/exercises# docker-compose up -d #컴포즈 실행
WARNING: The HOST_IP variable is not set. Defaulting to a blank string.
Pulling accesslog (diamol/ch09-access-log:)...
latest: Pulling from diamol/ch09-access-log
e7c96db7181b: Pull complete
bbec46749066: Pull complete
89e5cf82282d: Pull complete
5de6895db72f: Pull complete
3b73adc3529c: Pull complete
e701d787ca60: Pull complete
8b5c1e8d03e8: Pull complete
Digest: sha256:8c721119f4d3b4d4b22e81a5da3fae03964d0cb1446ea3cf675fdb9ea2bcc484
Status: Downloaded newer image for diamol/ch09-access-log:latest
Pulling iotd (diamol/ch09-image-of-the-day:)...
latest: Pulling from diamol/ch09-image-of-the-day
45b42c59be33: Pull complete
c3f1fbf102b7: Pull complete
1067f9902c49: Pull complete
e1e4050aab9e: Pull complete
7f89f58f441d: Pull complete
6d7217f14fb6: Pull complete
eea72328ade4: Pull complete
Digest: sha256:778625ebdc3da27ef4babdafb4a82117a06852fda5315192902ee614b1906b29
Status: Downloaded newer image for diamol/ch09-image-of-the-day:latest
Pulling image-gallery (diamol/ch09-image-gallery:)...
latest: Pulling from diamol/ch09-image-gallery
31603596830f: Pull complete
792f5419a843: Pull complete
06087fe2cb64: Pull complete
ceaf7526f585: Pull complete
a1c0b04689a0: Pull complete
Digest: sha256:7c168435d594012d8d5523eaceb5366fad26f5977e46396a5093f6e536f9123b
Status: Downloaded newer image for diamol/ch09-image-gallery:latest
Pulling prometheus (diamol/ch09-prometheus:)...
latest: Pulling from diamol/ch09-prometheus
8e674ad76dce: Already exists
e77d2419d1c2: Already exists
04226839fe4a: Already exists
3cae5fa509c3: Already exists
f9839cdfbdeb: Already exists
4a18db143139: Already exists
0e348fd2f909: Already exists
6bb68a4c5375: Already exists
8ee857f8bcae: Already exists
8991f641442d: Already exists
6a004a5edfe6: Pull complete
Digest: sha256:65ad09e4583da136dd3e39447412df298567f60b6aee65e5bab650e0b3feebcf
Status: Downloaded newer image for diamol/ch09-prometheus:latest
Creating exercises_accesslog_1  ... done
Creating exercises_prometheus_1 ... done
Creating exercises_iotd_1       ... done
Creating exercises_image-gallery_1 ... done

#'http://localhost:8010/' 로 접속시 NASA 천체사진이 뜨며
#'http://localhost:8010/metrics' 시 측정값을 볼 수 있다.
웹 브라우저를 통해 프로메테우스에 접근하면 이와 비슷한 형태로 자바 REST API의 측정값을 볼 수 있다.
언뜻 어수선한 텍스트들의 모임처럼 보이지만 그안에는 다양한 정보들(CPU 시간, 메모리, 스레드 등 점유율)을 한눈에 알 수 있는 대시보드를 만들기 위해 필요한 정보가 모두 포함되어 있다.
해당 런타임 측정값과 도커 엔진에서 얻은 인스트럭처 측정값을 제공하지만 이 두개의 수준으로는 알수없는 정보도 있다. ex) 애플리케이션 측정값 (연산 중심의 정보, 비즈니스 중심 정보..etc)
물론 이러한 정보들 또한 프로메테우스 클라이언트 라이브러리를 사용하면 수집이 가능하지만 애플리케이션에서 명시적으로 이들 정보를 생성하는 코드를 작성해야한다.
프로메테우스 측정값에도 몇가지 유형이 있는데. 해당 애플리케이션에서 사용한 유형은 그중에서도 간단한 종류인 카운터와 게이지이다.
실습2 (부하 테스트 및 측정값 확인)
root@DESKTOP-KU8L7UV:/home/user/080258/ch09/exercises# for i in {1..5}; do curl http://localhost:8010 > /dev/null; done
  % Total    % Received % Xferd  Average Speed   Time    Time     Time  Current
                                 Dload  Upload   Total   Spent    Left  Speed
100     6  100     6    0     0   4862      0 --:--:-- --:--:-- --:--:--  6000
  % Total    % Received % Xferd  Average Speed   Time    Time     Time  Current
                                 Dload  Upload   Total   Spent    Left  Speed
100   762  100   762    0     0    593      0  0:00:01  0:00:01 --:--:--   593
  % Total    % Received % Xferd  Average Speed   Time    Time     Time  Current
                                 Dload  Upload   Total   Spent    Left  Speed
100   762  100   762    0     0    99k      0 --:--:-- --:--:-- --:--:--  106k
  % Total    % Received % Xferd  Average Speed   Time    Time     Time  Current
                                 Dload  Upload   Total   Spent    Left  Speed
100   762  100   762    0     0   119k      0 --:--:-- --:--:-- --:--:--  124k
  % Total    % Received % Xferd  Average Speed   Time    Time     Time  Current
                                 Dload  Upload   Total   Spent    Left  Speed
100   762  100   762    0     0   116k      0 --:--:-- --:--:-- --:--:--  124k
root@DESKTOP-KU8L7UV:/home/user/080258/ch09/exercises#
#조회
조회
프로메테우스는 직접 측정값을 대상 시스템에서 받아다 수집하는 풀링 방식으로 동작
스크래핑(scraping): 측정값을 수집하는 과정
프로메테우스가 실행하면 스크래핑 대상은 엔드포인트를 설정해야 한다.
운영환경의 컨테이너 플랫폼에서는 클러스터에 있는 모든 컨테이너를 찾도록 설정 또한 가능
예제1 (애플리케이션 측정값을 스크래핑하기 위한 프로메테우스 설정)
vi prometheus/prometheus.yml
global:
  scrape_interval: 10s #스크래핑 간격 10ㅊ초

scrape_configs: #각 컴포넌트 마다 스크래핑 작업을 의미하는 job설정이 정의되어 있다.
  - job_name: "image-gallery" #이름
    metrics_path: /metrics #엔드포인트
    static_configs: #대상 컨테이너 지정 정보 (정적 설정: 단일 컨테이너 지정)
      - targets: ["image-gallery"]

  - job_name: "iotd-api"
    metrics_path: /actuator/prometheus
    static_configs:
      - targets: ["iotd"]

  - job_name: "access-log"
    metrics_path: /metrics
    scrape_interval: 3s
    dns_sd_configs: #대상 컨테이너 지정 정보 (DNS 서비스 디스커버리 기능 사용, 다중 컨테이너 지정 가능, 스케일링에 따라 대상 컨테이너 자동 확대)
      - names:
          - accesslog
        type: A
        port: 80
#10초 마다 모든 컨테이너를 한번씩 측정값을 수집
#'image-gallery'에 대한 설정은 단일 컨테이너 대싱이므로 스케일링을 적용하면 의도하지 않은 동작을 보일 수 있다.
#'access-log' 여러 IP주소를 상정해 설정 됬으므로 모든 컨테이너의 ip주소를 목록으로 만들어 이들 모두에게서 같은 간격으로 측정값을 수집한다.
실습1 (스케일링 측정 적용)
root@DESKTOP-KU8L7UV:/home/user/080258/ch09/exercises# docker-compose -f docker-compose-scale.yml up -d --scale accesslog=3
WARNING: The HOST_IP variable is not set. Defaulting to a blank string.
exercises_prometheus_1 is up-to-date
Recreating exercises_accesslog_1 ...
Recreating exercises_accesslog_1 ... done
Creating exercises_accesslog_2   ... done
Creating exercises_accesslog_3   ... done
exercises_image-gallery_1 is up-to-date
root@DESKTOP-KU8L7UV:/home/user/080258/ch09/exercises# for i in {1..10}; do curl http://localhost:8010 > /dev/null; done
  % Total    % Received % Xferd  Average Speed   Time    Time     Time  Current
                                 Dload  Upload   Total   Spent    Left  Speed
100   776  100   776    0     0    225      0  0:00:03  0:00:03 --:--:--   225
  % Total    % Received % Xferd  Average Speed   Time    Time     Time  Current
                                 Dload  Upload   Total   Spent    Left  Speed
100   776  100   776    0     0   100k      0 --:--:-- --:--:-- --:--:--  108k
  % Total    % Received % Xferd  Average Speed   Time    Time     Time  Current
                                 Dload  Upload   Total   Spent    Left  Speed
100   776  100   776    0     0  92491      0 --:--:-- --:--:-- --:--:-- 97000
  % Total    % Received % Xferd  Average Speed   Time    Time     Time  Current
                                 Dload  Upload   Total   Spent    Left  Speed
100   776  100   776    0     0   187k      0 --:--:-- --:--:-- --:--:--  252k
  % Total    % Received % Xferd  Average Speed   Time    Time     Time  Current
                                 Dload  Upload   Total   Spent    Left  Speed
100   776  100   776    0     0  99347      0 --:--:-- --:--:-- --:--:--  108k
  % Total    % Received % Xferd  Average Speed   Time    Time     Time  Current
                                 Dload  Upload   Total   Spent    Left  Speed
100   776  100   776    0     0   185k      0 --:--:-- --:--:-- --:--:--  252k
  % Total    % Received % Xferd  Average Speed   Time    Time     Time  Current
                                 Dload  Upload   Total   Spent    Left  Speed
100     6  100     6    0     0   7398      0 --:--:-- --:--:-- --:--:--  6000
  % Total    % Received % Xferd  Average Speed   Time    Time     Time  Current
                                 Dload  Upload   Total   Spent    Left  Speed
100   776  100   776    0     0   163k      0 --:--:-- --:--:-- --:--:--  189k
  % Total    % Received % Xferd  Average Speed   Time    Time     Time  Current
                                 Dload  Upload   Total   Spent    Left  Speed
100   776  100   776    0     0   190k      0 --:--:-- --:--:-- --:--:--  252k
  % Total    % Received % Xferd  Average Speed   Time    Time     Time  Current
                                 Dload  Upload   Total   Spent    Left  Speed
100   776  100   776    0     0   171k      0 --:--:-- --:--:-- --:--:--  189k
root@DESKTOP-KU8L7UV:/home/user/080258/ch09/exercises#
실습2 (측정값 확인)
Execute 클릭시 출력된다.
값(value)항목을 보면 로드밸런싱이 얼마나 고르게 부하를 분배했는지 알 수 있다.
이상적인 상황이라면 해당 측정값이 모두 같겠지만
로드밸런싱에 네트워크가 관여하는 부분이 많으므로 단일 서버에서 도커를 실행했다면 측정값이 완전히 같은경우는 보기 힘들다.
레이블을 붙혀 측정값에 정보를 추가하는 기능은 프로메테우스의 기능 중에서도 가장 강력한 것 중 하나며 같은 측정값을 다양한 입도(granularity)에서 다룰 수 있다.
현제 실습2(으)로 출력된 것은 날것 그대로의 측정값이며 각 줄이 하나의 컨테이너에서 수집한 가장 최근 값이 된다.
여러 쿼리(ex-sum())를 이용하여 값을 구할 수도 있다.
실습3 (프로메테우스 쿼리 사용해보기)
sum(access_log_total) without(hostname, instance)
시간 축에 대한 선 그래프 형태로 나타난 측정값 추이
'sum()' 쿼리는 프로메테우스에서 쓰이는 쿼리 언어인 PromQL로 구현돼 있다.
PromQL은 쿼리 값의 시간에 따른 추이 또는 변화율을 확인하거나 측정 값 간의 상관관계를 보여주는 여러 통계 함수를 갖추고 있다. (유용한 대시보드 만드는데 꼭 필요하지는 않음)
프로메테우스 포맷은 구조화가 잘 되어 있어 간단한 쿼리로도 핵심 측정값을 시각화가 가능하다. (기본적인 기능만으로도 괜찬은 대시보드 작성 가능)
하지만 프로메테우스 웹 UI는 대시보드라고 하기엔 부족함이 많다 진정한 대시보드를 만들려면 이와 연계하여 그라파나(Grafana)같은 도구를 사용해야한다.
프로메테우스를 통해 데이터를 수집하였다면 측정값을 열람하거나 데이터 시각화를 위한 쿼리를 확인하고 손보는데 프로메테우스 웹 UI를 사용하고 이 쿼리를 연결하여 대시보드를 연결해야 하는데 여기서 그라파나를 사용한다.
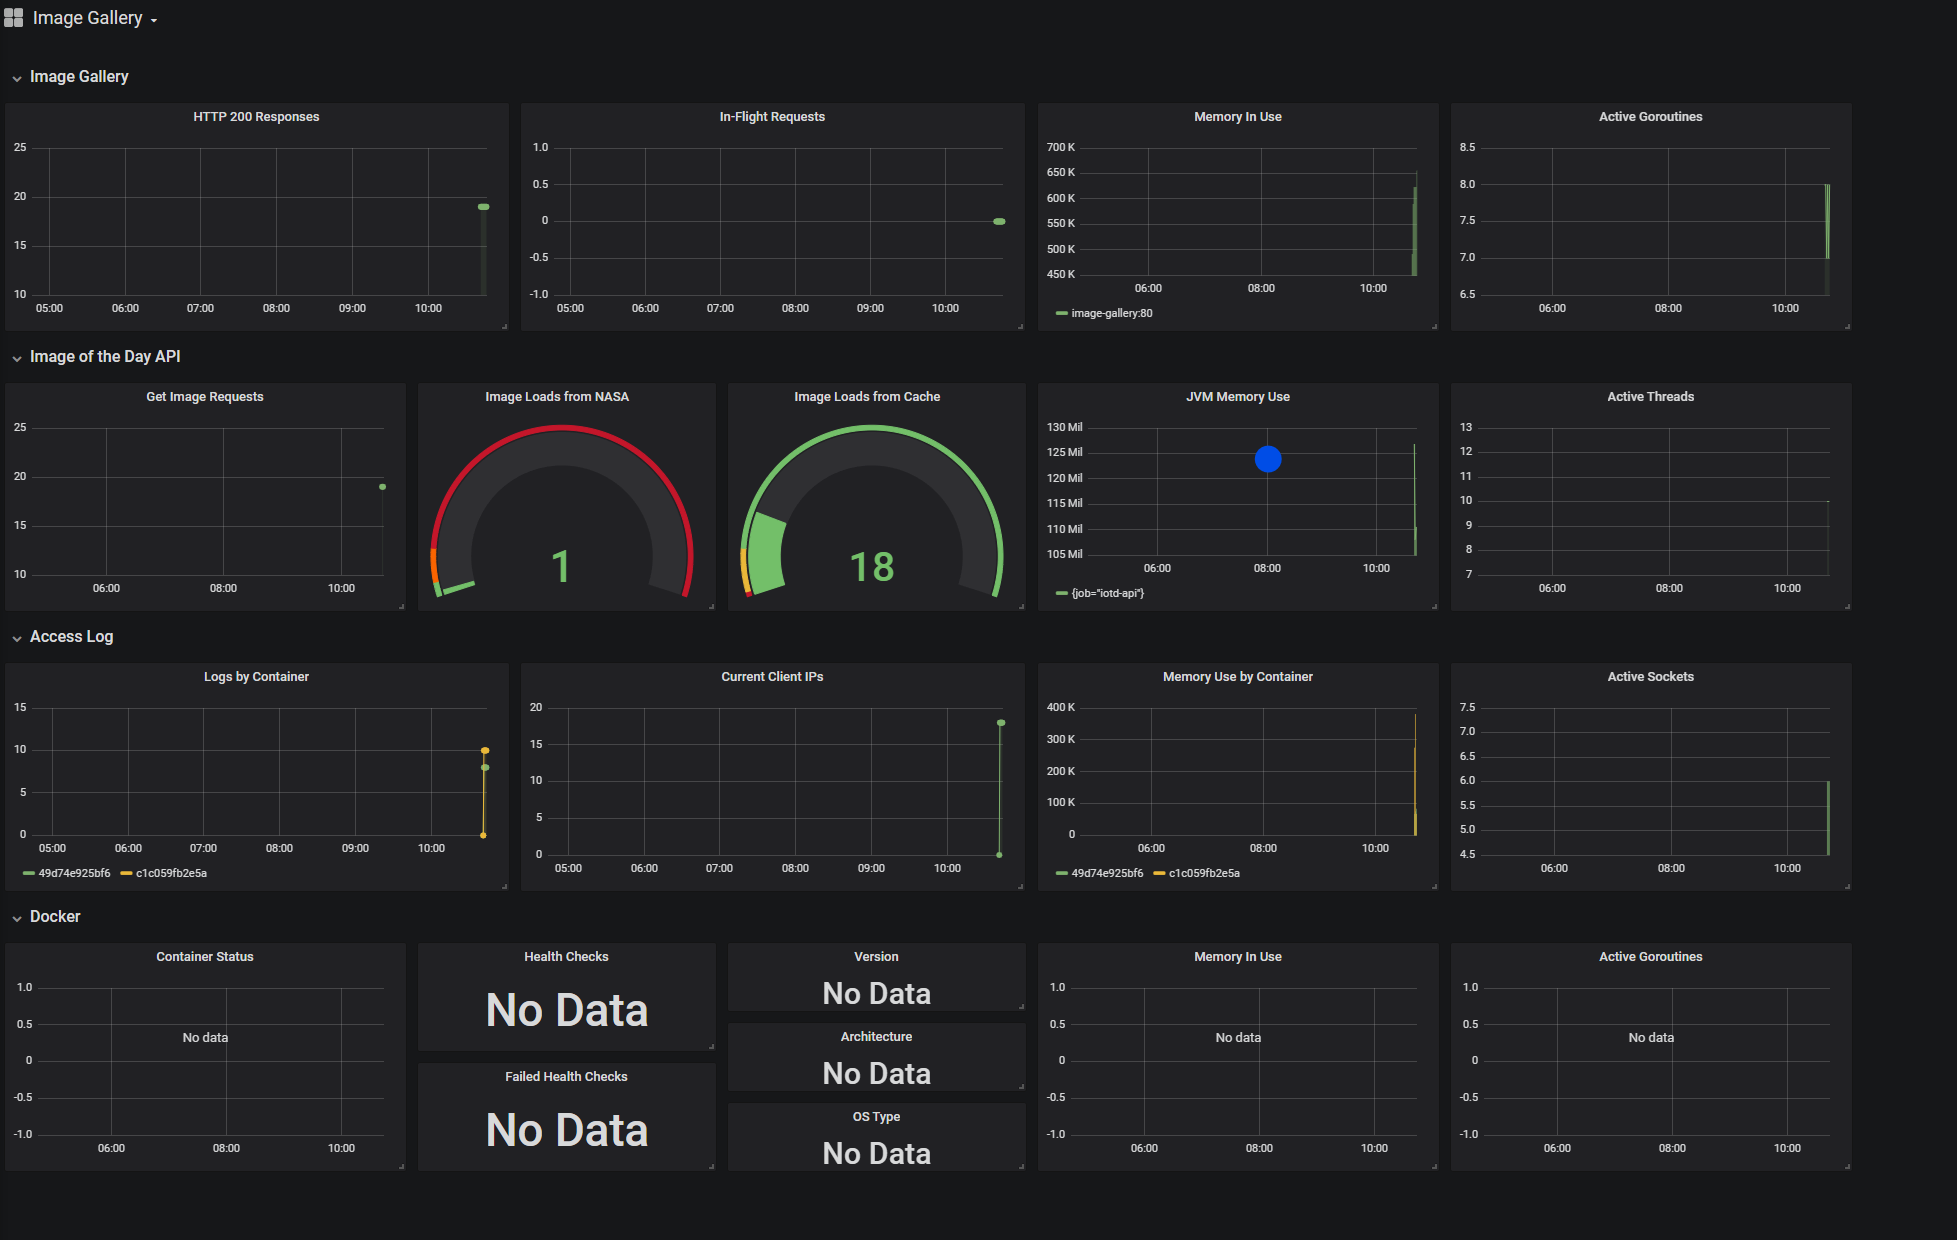
그라파나를 사용하면 각 데이터 점(data point)(는)은 이해하기 쉽게 시각화되며, 대시보드로 애플리케이션의 상황을 일목요연하게 파악가능하다.
그라파나 대시보드는 애플리케이션의 모든 구성 요소와 도커 런타임의 상태를 한눈에 알 수 있는 유용한 수단
애플리케이션의 핵심 정보를 다양한 수준에서 제공(PromQL를 이용해 단일쿼리로 작성된 그래프)
실습1 (그라파나 테스트)
root@DESKTOP-KU8L7UV:/home/user# export HOST_IP=$(ip route get 1 | awk '{print $NF;exit}')
root@DESKTOP-KU8L7UV:/home/user/080258/ch09/exercises# docker-compose -f ./docker-compose-with-grafana.yml up -d --scale acc
esslog=3
Pulling grafana (diamol/ch09-grafana:)...
latest: Pulling from diamol/ch09-grafana
9d48c3bd43c5: Pull complete
df58635243b1: Pull complete
09b2e1de003c: Pull complete
f21b6d64aaf0: Pull complete
719d3f6b4656: Pull complete
d18fca935678: Pull complete
7c7f1ccbce63: Pull complete
6c52f63835cd: Pull complete
08cccb2a8b1c: Pull complete
05a7f3d85df9: Pull complete
Digest: sha256:9a236cc5fc2cd4aeaeb0e9eff3a2697f9376f2d1a6ef864ab29e6a41a09dd02f
Status: Downloaded newer image for diamol/ch09-grafana:latest
Starting exercises_iotd_1         ... done
Recreating exercises_prometheus_1  ... done
Starting exercises_accesslog_1    ... done
Starting exercises_accesslog_2    ... done
Starting exercises_accesslog_3    ... done
Starting exercises_image-gallery_1 ... done
Creating exercises_grafana_1       ... done
root@DESKTOP-KU8L7UV:/home/user/080258/ch09/exercises# for i in {1..20}; do curl http://localhost:8010 > /dev/null; done
  % Total    % Received % Xferd  Average Speed   Time    Time     Time  Current
                                 Dload  Upload   Total   Spent    Left  Speed
100   776  100   776    0     0    691      0  0:00:01  0:00:01 --:--:--   691
  % Total    % Received % Xferd  Average Speed   Time    Time     Time  Current
                                 Dload  Upload   Total   Spent    Left  Speed
100   776  100   776    0     0  49740      0 --:--:-- --:--:-- --:--:-- 51733
  % Total    % Received % Xferd  Average Speed   Time    Time     Time  Current
                                 Dload  Upload   Total   Spent    Left  Speed
100     6  100     6    0     0   6864      0 --:--:-- --:--:-- --:--:--  6000
  % Total    % Received % Xferd  Average Speed   Time    Time     Time  Current
                                 Dload  Upload   Total   Spent    Left  Speed
100   776  100   776    0     0  83413      0 --:--:-- --:--:-- --:--:-- 86222
  % Total    % Received % Xferd  Average Speed   Time    Time     Time  Current
                                 Dload  Upload   Total   Spent    Left  Speed
100   776  100   776    0     0  89773      0 --:--:-- --:--:-- --:--:-- 97000
  % Total    % Received % Xferd  Average Speed   Time    Time     Time  Current
                                 Dload  Upload   Total   Spent    Left  Speed
100   776  100   776    0     0  78741      0 --:--:-- --:--:-- --:--:-- 86222
  % Total    % Received % Xferd  Average Speed   Time    Time     Time  Current
                                 Dload  Upload   Total   Spent    Left  Speed
100   776  100   776    0     0   101k      0 --:--:-- --:--:-- --:--:--  108k
  % Total    % Received % Xferd  Average Speed   Time    Time     Time  Current
                                 Dload  Upload   Total   Spent    Left  Speed
100   776  100   776    0     0  89742      0 --:--:-- --:--:-- --:--:-- 97000
  % Total    % Received % Xferd  Average Speed   Time    Time     Time  Current
                                 Dload  Upload   Total   Spent    Left  Speed
100   776  100   776    0     0  98190      0 --:--:-- --:--:-- --:--:--  108k
  % Total    % Received % Xferd  Average Speed   Time    Time     Time  Current
                                 Dload  Upload   Total   Spent    Left  Speed
100   776  100   776    0     0  88111      0 --:--:-- --:--:-- --:--:-- 97000
  % Total    % Received % Xferd  Average Speed   Time    Time     Time  Current
                                 Dload  Upload   Total   Spent    Left  Speed
100   776  100   776    0     0   126k      0 --:--:-- --:--:-- --:--:--  151k
  % Total    % Received % Xferd  Average Speed   Time    Time     Time  Current
                                 Dload  Upload   Total   Spent    Left  Speed
100   776  100   776    0     0  92391      0 --:--:-- --:--:-- --:--:--  108k
  % Total    % Received % Xferd  Average Speed   Time    Time     Time  Current
                                 Dload  Upload   Total   Spent    Left  Speed
100   776  100   776    0     0   142k      0 --:--:-- --:--:-- --:--:--  151k
  % Total    % Received % Xferd  Average Speed   Time    Time     Time  Current
                                 Dload  Upload   Total   Spent    Left  Speed
100   776  100   776    0     0   114k      0 --:--:-- --:--:-- --:--:--  126k
  % Total    % Received % Xferd  Average Speed   Time    Time     Time  Current
                                 Dload  Upload   Total   Spent    Left  Speed
100   776  100   776    0     0   103k      0 --:--:-- --:--:-- --:--:--  108k
  % Total    % Received % Xferd  Average Speed   Time    Time     Time  Current
                                 Dload  Upload   Total   Spent    Left  Speed
100   776  100   776    0     0  80531      0 --:--:-- --:--:-- --:--:-- 86222
  % Total    % Received % Xferd  Average Speed   Time    Time     Time  Current
                                 Dload  Upload   Total   Spent    Left  Speed
100   776  100   776    0     0  93867      0 --:--:-- --:--:-- --:--:-- 97000
  % Total    % Received % Xferd  Average Speed   Time    Time     Time  Current
                                 Dload  Upload   Total   Spent    Left  Speed
100   776  100   776    0     0   141k      0 --:--:-- --:--:-- --:--:--  151k
  % Total    % Received % Xferd  Average Speed   Time    Time     Time  Current
                                 Dload  Upload   Total   Spent    Left  Speed
100   776  100   776    0     0  92424      0 --:--:-- --:--:-- --:--:-- 97000
  % Total    % Received % Xferd  Average Speed   Time    Time     Time  Current
                                 Dload  Upload   Total   Spent    Left  Speed
100   776  100   776    0     0   100k      0 --:--:-- --:--:-- --:--:--  108k